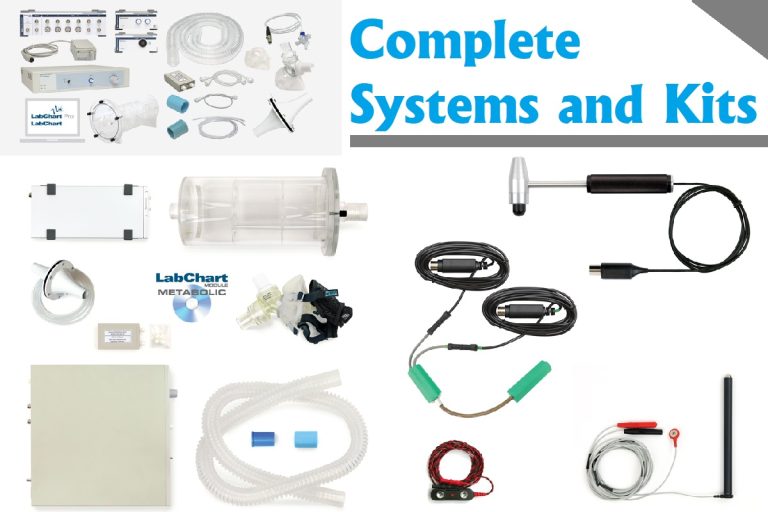
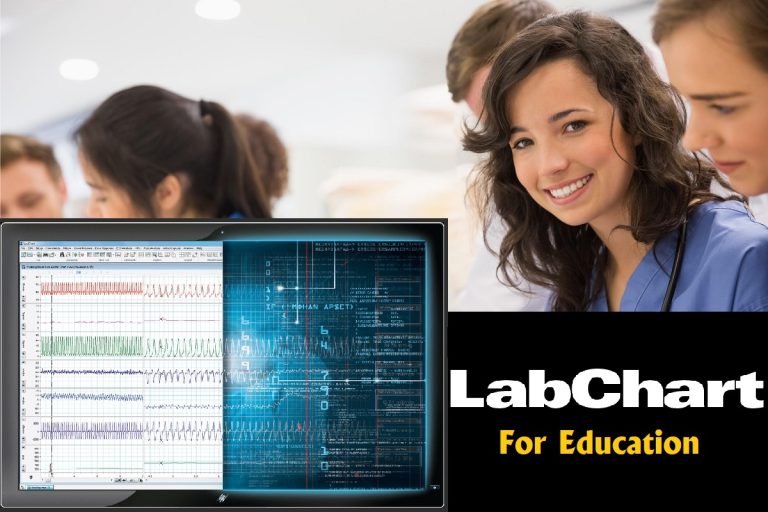
LabChart – Physiological Data Analysis Software
 What is LabChart?
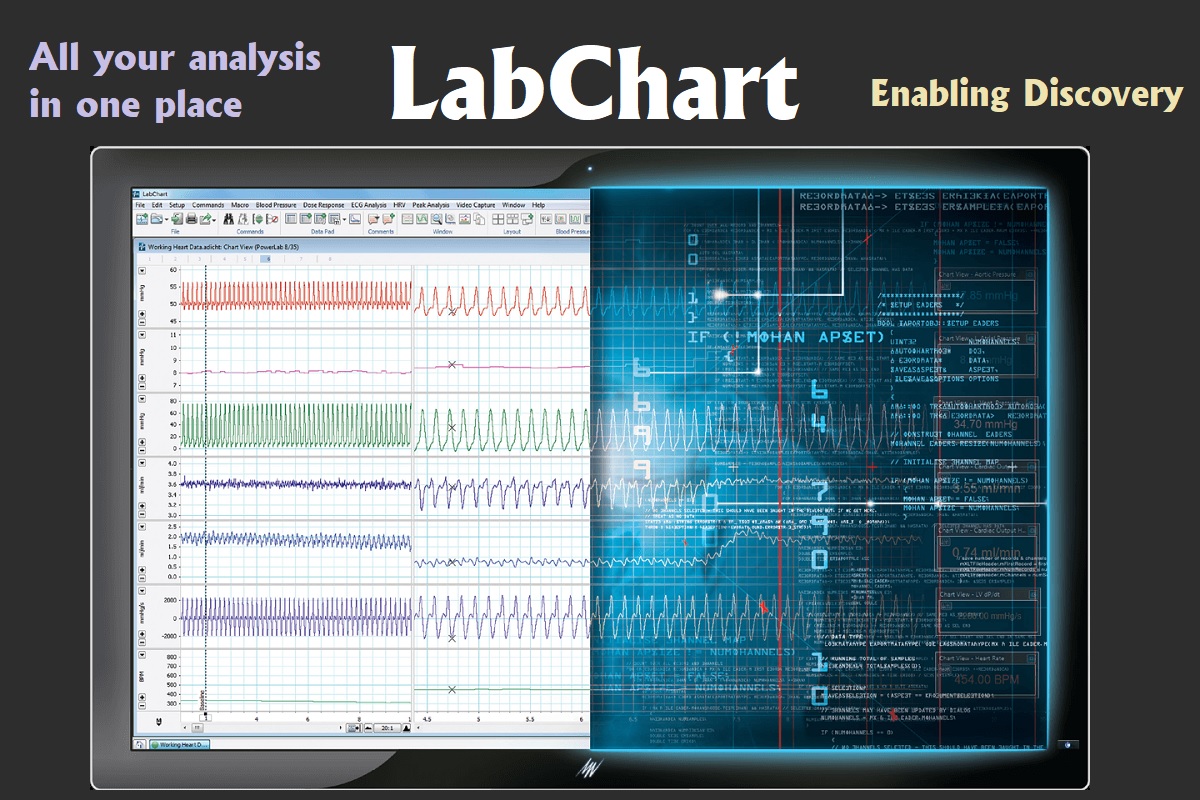
LabChart physiological data analysis software creates a platform for all of your recording devices to work together, allowing you to acquire biological signals from multiple sources simultaneously and apply advanced calculations and plots as your experiment unfolds.
LabChart and LabChart Lightning offer researchers and educators a powerful data acquisition software package capable of integrating with ADInstruments’ modular suite of DAQ hardware.
Data acquisition systems require high-speed integration across analog transduction, signal conditioning, data logging, and validation, all of which are supported by LabChart.
Data recording, analysis and visualization are also streamlined in the LabChart DAQ software packages.
High quality graph production is integrated within the software suites.
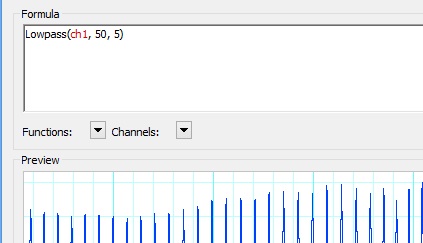
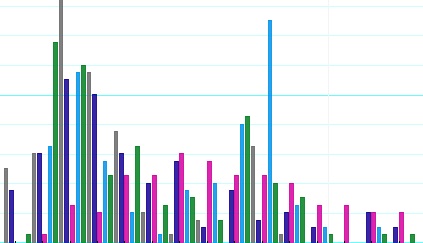
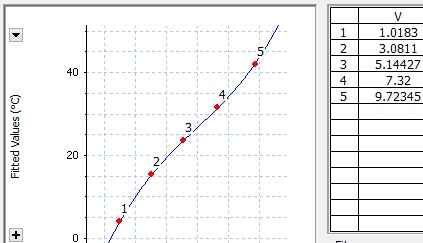
Both software packages permit the construction of specialized analyses and graphs such as peak analysis, spike histograms, and dose-response curves. Additionally, the data plot API permits users to visualize data in four different plot types and curve fits.
Totalled, ADInstruments’ DAQ software packages are an essential component of any DAQ system.


Autonomic
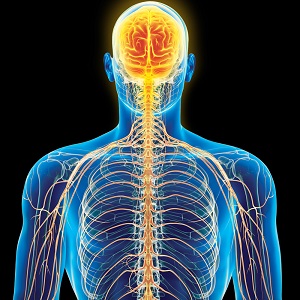 The human autonomic nervous system is the part of the peripheral nervous system that controls visceral functions such as heart rate, respiratory rate and digestion.
It consists of enteric, parasympathetic and sympathetic nervous systems and is regulated by the central nervous system, but functions largely autonomously, without conscious control.
Autonomic with ADInstruments
ADInstruments offers a single, streamlined system that can meet all of your specific Autonomic Nervous System research needs.
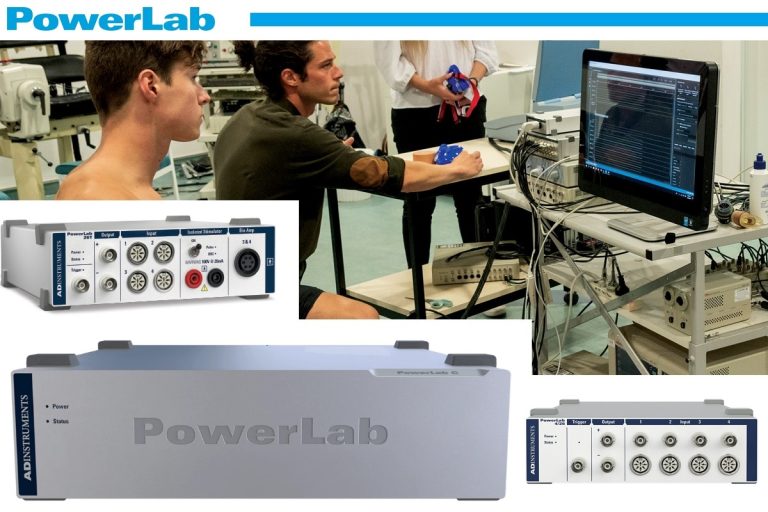
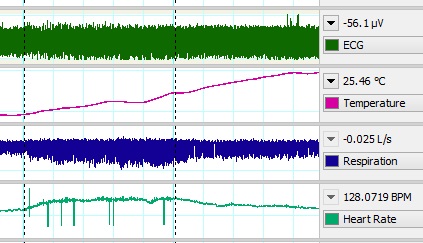
Using PowerLab and LabChart you can record and analyze a wide variety of cross application signals and then compare, clarify and evaluate your data, all in one place.
We also have a human approved research-grade microneurography amplifier – the Neuro Amp EX – developed in conjunction with Dr. Vaughan Macefield.
Applications we Support
Find More Information about Autonomic!
Cardiovascular
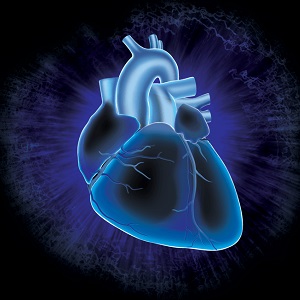 Cardiovascular research looks at the function of the heart and circulatory system during both health and disease.
From basic biological investigation through to disease focused research, and translational research with a bench to bedside focus, cardiovascular research is a diverse and multidisciplinary application.
Cardiovascular Research with ADInstruments
Whether your research is basic or translational, or somewhere in between, ADInstruments offers a range of solutions for accurate and sensitive human cardiovascular measurements. And with the ability to integrate data streams with non-invasive blood pressure, invasive blood pressure, ECG, plethysmography and more, our systems can evolve as your experiments do – ensuring quality results wherever your research takes you.
Applications we Support
Find More Information about Cardiovascular!
Exercise Physiology
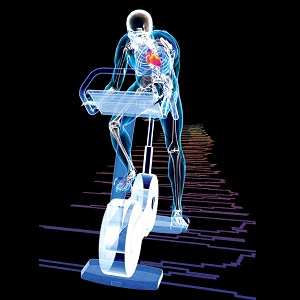 Exercise Physiology examines how physical activity influences the body’s cardiovascular system, endochrine system, and musculoskeletal system.
Exercise tests are usually performed under constant or increasing workloads.
Constant workloads are designed for subjects to reach a steady state of gas exchange, ventilation and heart rate, thereby investigating cardiopulmonary function under constant metabolic demand.
Increasing work loads are used to reach exhaustion in the subject and determine a maximal level of oxygen.
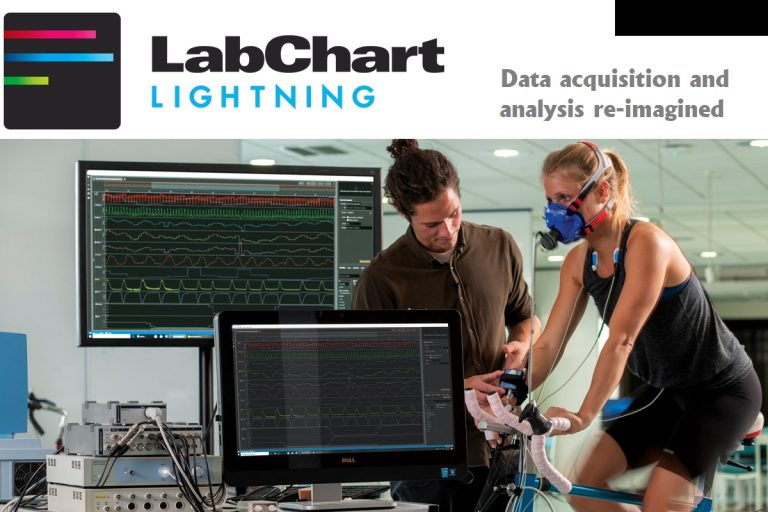
Exercise Physiology with ADInstruments
With wireless physiological monitoring, EMG and metabolic solutions alongside software capable of integrating all your data streams, it’s easy to display and analyse even more biological signals in real-time.
Our advanced technology and intuitive design creates the perfect balance of high quality data and ease-of-use – allowing you to take your exercise research further, faster.
Applications we Support
- Metabolic
- Non-Invasive Blood Pressure
- Wired Physiological Monitoring
- Wireless EMG
- Wireless Physiological Monitoring
Find More Information about Exercise Physiology!
Neuro
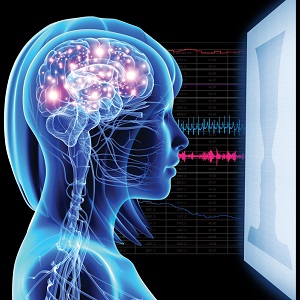
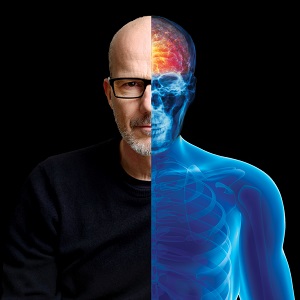 Neuroscience is a multidisciplinary field that studies the structure and function of the brain and nervous system.
It encompasses the evolution, development, and function of the nervous system as well as computational, behavioral and cognitive neuroscience.
Neuro with ADInstruments
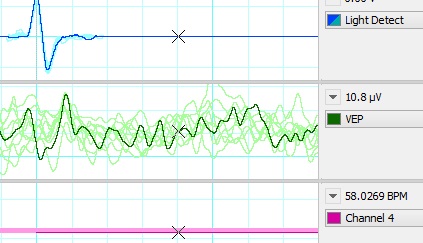
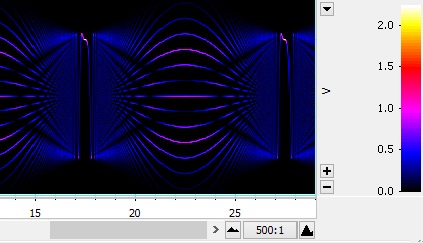
For a powerful EEG recording solution to complement your human neuro research applications you can combine PowerLab data acquisition hardware and LabChart analysis software with our high-performance differential bio amplifiers. LabChart forms a robust platform for multiple recording devices, allowing you to acquire biological signals from a range sources simultaneously. LabChart’s Spectrum Analysis feature is also ideal for performing multiple calculations for specific EEG frequency bands in real-time.
ADInstruments’ hardware and software systems support your need for flexibility in neuroscience by seamlessly integrating with a wide range of specialized third party equipment, so you can create specific solutions for your unique research requirements.
Applications we Support
Find More Information about Neuro!
Psychophysiology
 Psychophysiology is a science concerned with the psychological bases of physiological processes.
This typically involves measurement of a variety of different physiological parameters in response to a range of different physical or emotional stimuli.
Psychophysiology with ADInstruments
No matter which stimulus protocol you wish to run, ADInstruments offer a streamlined solution for integration of physiological response signals with your stimulus presentation.
With the ability to run protocols for a variety of different visual, physical, and auditory stimuli; and then easily synchronize these events with voluntary responses as well as either wireless or wired psychological response data such as skin conductance (GSR), ECG, EEG, EOG, and EMG, our systems have the flexibility to grow with your research. With both automated and customized analysis options we offer ease-of-use and flexibility so that you are in control of your insights.
Stimulus Presentation:
- Visual
- Physical
- Auditory
- Electrical
Evoked Physiological Responses:
- Skin Conductance | GSR or EDR
- Voluntary response e.g. push button or 10 point Likert scale
- ECG
- EEG
- EOG
- EMG
- Respiratory Rate
- NIBP
- Wireless and wired options available
Applications we Support
Find More Information about Psychophysiology!
Respiratory
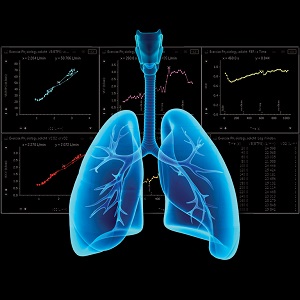 The primary function of breathing is to obtain oxygen for use by the body’s cells and eliminate carbon dioxide that the cells produce.
When we talk about respiratory research, we are referring to the airways leading into and out of the lungs (nasal and oral cavities, pharynx, trachea) and the lungs themselves (primary bronchi – right and left, bronchioles and alveoli, the sites of gaseous exchange).
Respiratory with ADInstruments
ADInstruments offers a diverse range of solutions for accurate and sensitive respiratory measurements to complement your human research applications.
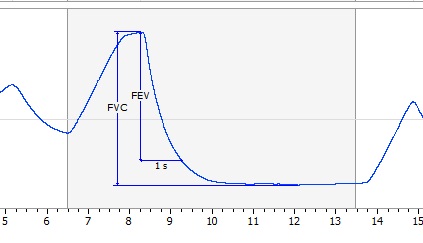
With the ability to integrate data streams from spirometry, pulse oximetry, respiratory belts and gas analysis with other physiological signals such as NIBP, wireless ECG, temperature and more, our systems can evolve as your experiments do – ensuring quality results wherever your research takes you.
Applications we Support
Find More Information about Respiratory!
Sleep Studies
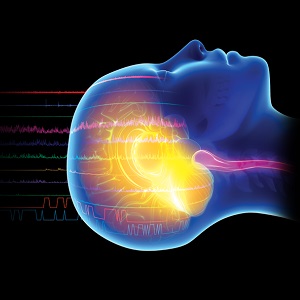 Sleep studies, also known as polysomnography, involves multi-faceted tests to monitor sleep stages and cycles in order to study sleep patterns and quality.
Electrodes are placed on the surface of the skin in various locations to gather comprehensive recordings of brain waves, eye movements, muscle activity, heart rhythm, and breathing during sleep.
Sleep Studies with ADInstruments
ADInstruments’ flexible and easily customized systems are the ideal tools for polysomnographic research. Our solutions are designed to be simple to setup and use, minimizing interference with your sleep study subjects to ensure accurate recording and results.
We can help you match LabChart and PowerLab with a comprehensive range of solutions for recording a variety of signals including biopotentials, spirometry and wireless physiological monitoring, giving you the power choose robust combinations that best meet your requirements. Our software is algorithm agnostic giving you the ability to easily customize macros suited for your preferred sleep scoring methodology. Talk to us about your specific needs, and our experienced team of researchers can work closely with you to custom design a data acquisition and analysis solution that will help you reach your sleep research goals faster.
Applications we Support
Find More Information about Sleep Studies!
Tissue and Circulation
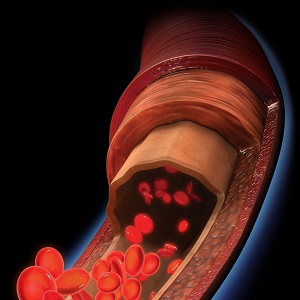 Blood circulation, or blood flow, ensures the transport of oxygen to tissues throughout the human body.
In turn, adequate circulation and tissue health are synonymous with cardiovascular health, the survival of surgical patients, longevity, and general quality of life.
Researching tissue and circulation in human subjects is possible using safe and non-invasive techniques like laser Doppler flowmetry (LDF), pulse oximetry and plethysmography.
Tissue and Circulation with ADInstruments
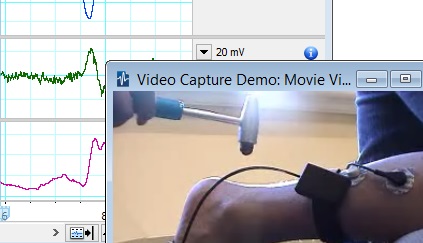
ADInstruments supports your research with a wide range of high-quality systems and solutions that are safe for peripheral circulation research in human subjects. Using PowerLab and LabChart as a base you can easily build a complete solution to meet your exact research requirements. Our human approved solutions for laser Doppler flowmetry include the INL191 Blood FlowMeter and a range of different probe types. We also support blood flow monitoring and oxygen saturation measurements with a variety of infrared plethysmographs and oximeter pods which can be worn comfortably by your study subjects.
Applications we Support
Find More Information about Tissue and Circulation!
Autonomic
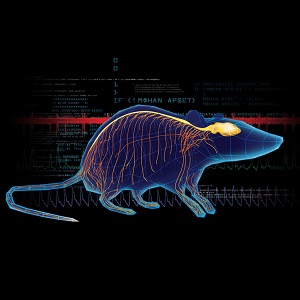 The autonomic nervous system is the part of the peripheral nervous system that controls visceral functions such as heart rate, respiratory rate, and digestion.
It consists of enteric, parasympathetic and sympathetic nervous systems and is regulated by the central nervous system, but functions largely autonomously, without conscious control.
Autonomic with ADInstruments
ADInstruments offers a single system that can meet all your Autonomic Nervous System research needs. Use LabChart to collect and synchronize a wide range of cross-application signals and then compare, clarify and evaluate your data.
Our team can customize any of our systems to meet your precise needs, helping you to record and read the exact data that you need in the most efficient and effective way possible. Enjoy simple setup, cutting-edge technology and flexible analysis options for autonomic research – everything you need to get notable results with integrity, all in one simple, streamlined system.
Applications we Support
Find More Information about Autonomic for Animal!
Tissue and Circulation
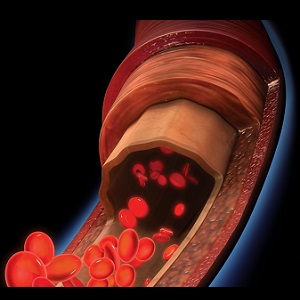 The circulation of blood ensures the transport of oxygen to tissues throughout the body.
Research studies focusing on blood circulation and tissue health are related to cardiovascular health, the survival of surgical patients, longevity and quality of life.
Tissue and Circulation with ADInstruments
ADInstruments supports Tissue and Circulation research with a wide range of high-quality solutions for research studies using animals.
Using PowerLab and LabChart as a base, you can record and analyze blood flow in both small and large animals.
Implant intra- or perivascular flow probes in or around blood vessels.
Pair state-of-the-art ultrasound transit-time technology with PowerLab to measure blood flow rate in milliliters per minute.
Our solutions for Laser Doppler Flow include the INL191 Blood FlowMeter and calibration kit, as well as surface and needle probes.
Applications we Support
- Pulse and Plethysmography
- Tissue Oxygen
- Tissue Perfusion
Find More Information about Tissue and Circulation for animal!
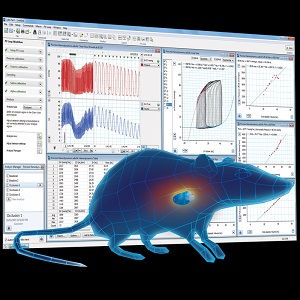
Telemetry
 Telemetry is wireless technology that lets researchers record and transfer data from a remote system.
Sensors at the source measure data and send the data to a receiver.
The use of telemetry in animal research is a recommended industry practice for improved animal welfare.
Using wireless telemetry lets researchers work with conscious, freely moving animals and reduces stress artifacts in the research data.
Wireless telemetry is suitable for studies that need continuous recording for extended periods and is useful for the ability to record multiple data points from a single subject.
Telemetry with ADInstruments
For the wireless recording of a variety of biological signals in small animals, ADInstruments offers our telemetry brand, Kaha Sciences.
Extensively used globally in academic and research institutions as well as biotechnology and pharmaceutical companies, Kaha systems paired with PowerLab and LabChart sets the new standard in quality and power for implantable, wireless telemetry in rats and mice.
Measure true high-fidelity signals such as ventricular and arterial pressures, sympathetic nerve activity (SNA), biopotentials (e.g. ECG, EMG & EEG), tissue oxygen, and optogenetics stimulating and recording.
Benefits of telemetry
The use of telemetry within animal research is beneficial for a wide array of reasons and is a recommended industry practice for improved animal welfare.
- Ability to work with conscious, freely moving animals
- Improved animal welfare and reduced stress artefacts results in improved data quality
- Suitable to studies requiring continuous recording across extended periods
- Ability to record multiple data points from a single subject
- Lowered animal costs
Applications we Support
Find More Information about Telemetry for animal!
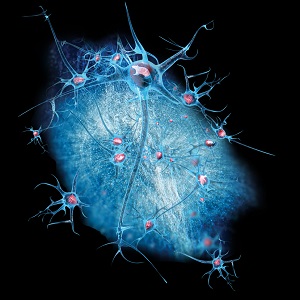
Neuroscience
Neuroscience studies apply the principles of biology (in particular neurobiology) to the study of the physiological, genetic, and developmental mechanisms of behavior in animals as a way to better understand human pathology and to contribute to evidence-based practice.
Typically, investigations are at the level of nerves, neurotransmitters, brain circuitry and the basic biological processes that underlie normal and abnormal behavior.
Neuroscience with ADInstruments
PowerLab and LabChart integrate seamlessly with a huge range of third-party equipment to provide the flexibility and power you need for your unique behavioral neuroscience research.
Work with our team of experienced scientists to tailor the perfect solution for your needs.
With simple, streamlined software, specialized support and the highest quality data integrity, ADInstruments provides easily customizable systems for all your neuroscience needs.
Applications we Support
Find More Information about Neuroscience for animal!
Cardiovascular
 Cardiovascular research focuses on physiology of the heart and cardiovascular system.
From basic biological investigation through to disease focused research, and translational research with a bench to bedside focus, cardiovascular research in animals is a diverse and multidisciplinary application.
Cardiovascular with ADInstruments
Whether your research is basic or translational, or somewhere in between, ADInstruments offers a range of solutions for accurate and sensitive cardiovascular measurements.
And with the ability to integrate data streams from blood flow, NIBP, isolated heart, arterial pressure, ventricular pressure and volume, laser doppler flow, electrophysiology and more, our systems can evolve as your experiments do – ensuring quality results wherever your research takes you.
Applications we Support
Cardio Electrophysiology
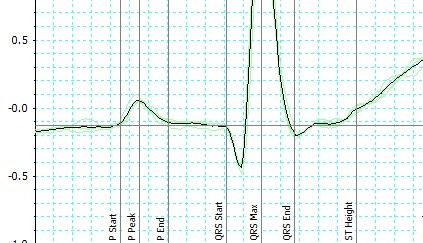
Cardiovascular Electrophysiology allows for the precise measurement and analysis of ECG waveforms, heart rate variability, arrhythmias, waveform morphology, and cardiac action potentials.
Whether measuring surface or intracardiac ECG, and whether stimulating, pacing, or just recording, LabChart’s tailored tools and modules enable easy and powerful data analysis.
Hemodynamics
Hemodynamics is the investigation into the dynamics of blood pressure the forces required for the heart to pump and circulate blood flow throughout the cardiovascular system.
As a vast majority of all cardiovascular disease and disorder relate to hemodynamic functions, this is an important and highly studied area of cardiovascular research.
- Invasive Blood Flow
- Invasive Blood Pressure
- Non Invasive Blood Pressure
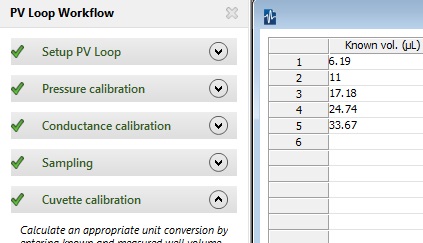
- Ventricular Pressure Volume + PV Loops
Isolated Heart Systems
Whether you want to monitor mechanical and electrical cardiac parameters without the influence of other physiological processes, examine the influence of preload and afterload on cardiac work or record atrial and aortic pressures, our isolated heart systems can support your research with simple set up, flexible recording and powerful analysis.
Find More Information about Cardiovascular for animal!
Pharmacology + Isolated Tissue and Organs
 Pharmacology is the science of drug action on biological systems.
It requires knowledge of drug sources, chemical properties, biological effects and therapeutic uses of drugs.
In vitro pharmacological studies include the use of tissue-organ baths, organ perfused apparatus and Ussing chambers.
Record & measure in vitro tissue response and muscle tension measurements for pharmacology research using our complete organ bath systems.
ADInstruments offer all-in-one or modular Organ Baths with specialist hardware from Radnoti or PanLab.
All systems include gas and temperature control to provide an ideal environment for tissue viability.
Pharmacology + Isolated Tissue and Organs with ADInstruments
Streamline your pharmacology / isolated tissue & organ research and maximize efficiency by recording and measuring in vitro muscle and tissue response using Powerlab and LabChart as an acquisition and analysis base.
Combine your choice with our range of complementary equipment and products including our all-in-one and modular organ bath systems to accurately study the effects of pharmacological agents of smooth muscle contractions in single or multiple tissue preparations.
Additionally, we provide working heart and Langendorff systems to study inherent contraction and relaxation properties of an intact isolated heart.
A range of supplementary accessories and consumables are also available.
LabChart provides streamlined software to measure and analyze changes in force, pressure, volume, flow rate, and many additional functions for pharmacological and cardiovascular research.
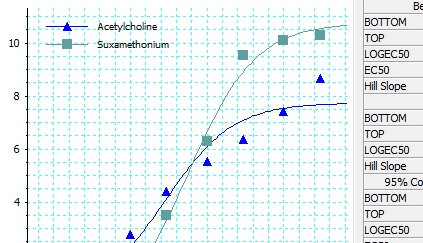
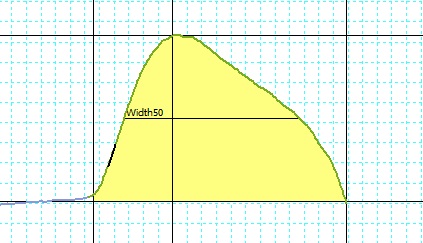
We also offer a Dose Response and Peak Analysis Add-Ons, with analysis and graphical display of pharmacologically evoked responses recorded in LabChart.
Applications we Support
Find More Information about Pharmacology + Isolated Tissue and Organs!
Electrophysiology
Electrophysiology is the study of the electrical properties of biological cells and tissues.
It involves measurements of voltage change or electrical current flow on a wide variety of scales from single ion channels to whole tissues like the heart. In neuroscience, it includes measurements of the electrical activity of neurons, and particularly action potential activity.
Electrophysiology with ADInstruments
When it comes to carrying out research, having the electrophysiology tools to easily handle a diverse set of requirements is vital.
With PowerLab and LabChart at the core of any ADInstruments solution, you are equipped with the foundation to easily develop a customized solutions for your unique research focus.
Offering high spec electrophysiology solutions to acquire a range of quality recordings from patch clamp systems to biopotential signals – or the option to integrate your own electrophysiology hardware configurations – you can then easily apply advanced calculations in LabChart as your experiment unfolds.
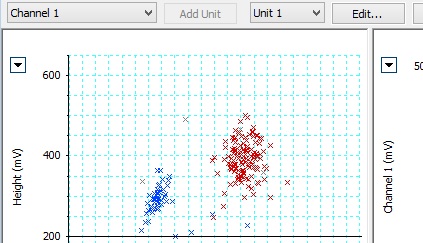
With the option of customizable analysis options or standard features such as peak analysis, scope view, arithmetic, artifact recognition and characterization of cell firing – you are free to experiment with confidence.
Applications we Support
Find More Information about Electrophysiology!