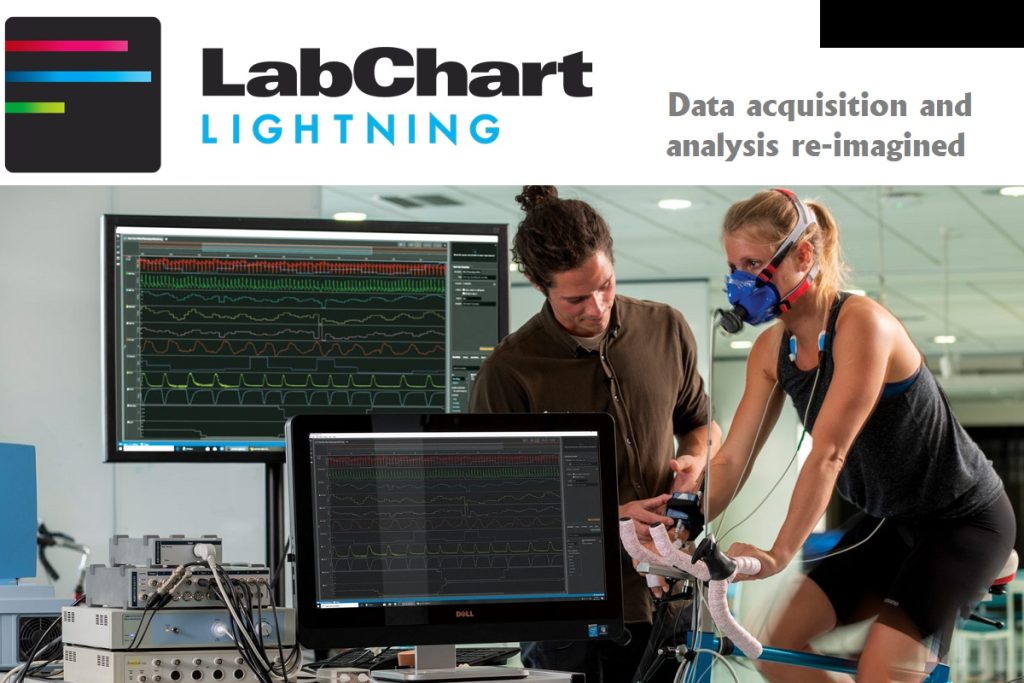
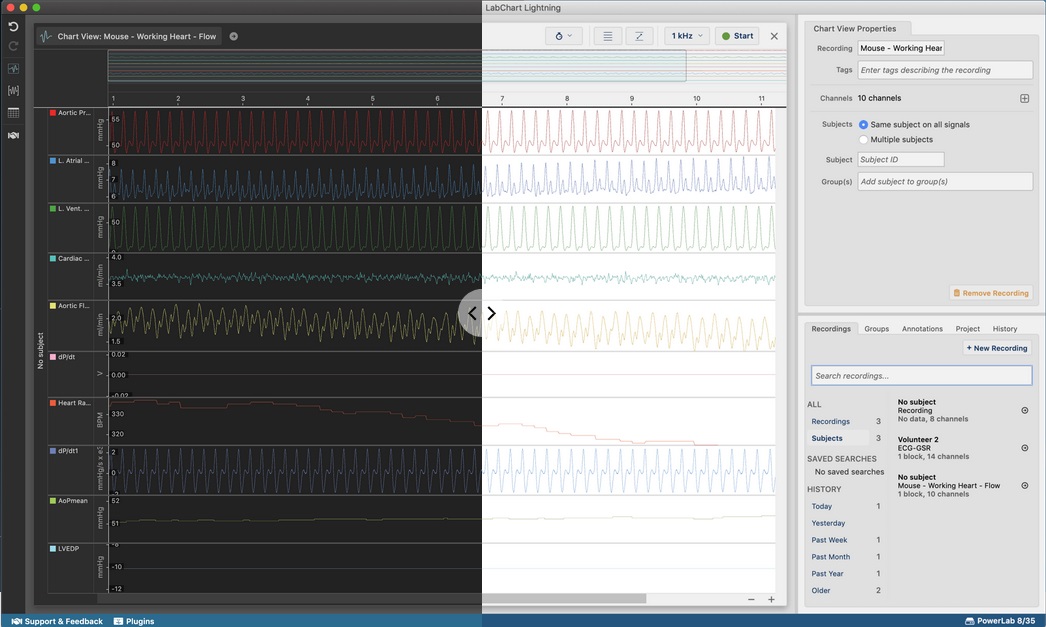
LabChart Lightning – Data Acquisition and Analysis Software
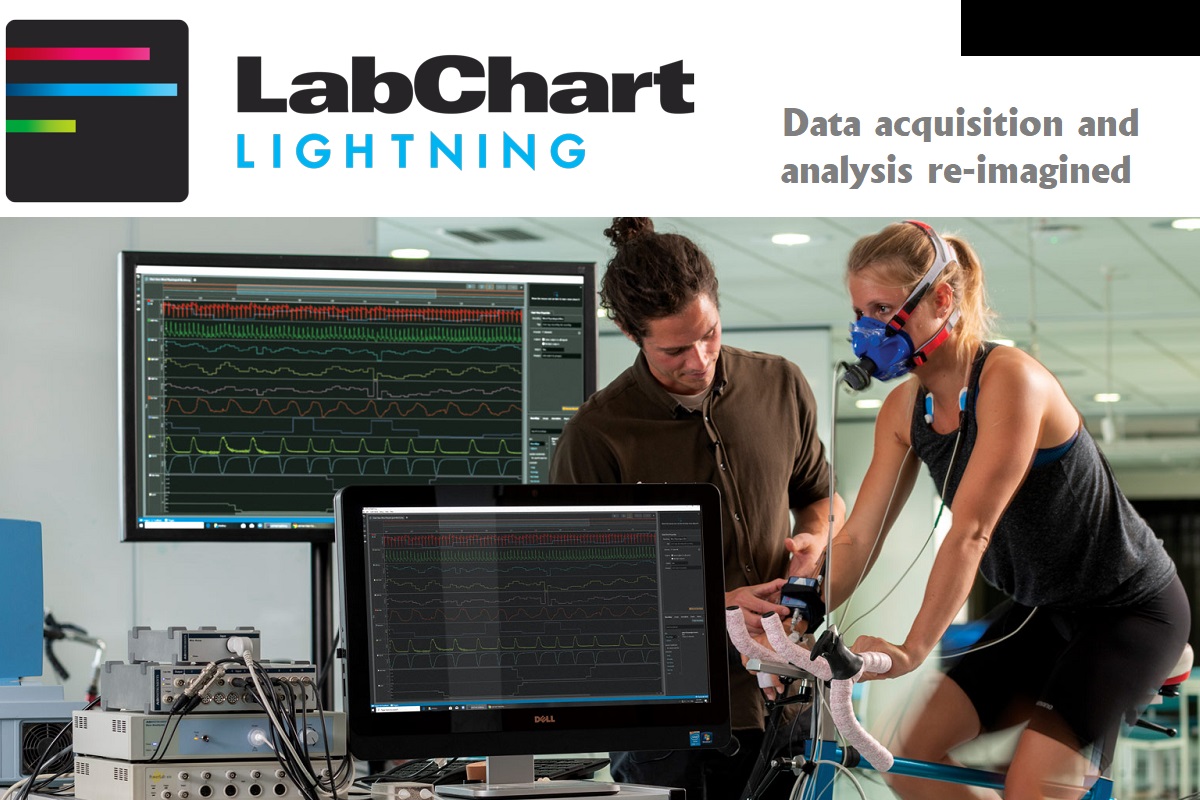 LabChart Lightning is the latest iteration of our 34 year history of creating easy to use data acquisition and analysis software. LabChart Lightning empowers innovative researchers to make unique scientific discoveries with unlimited freedom and flexibility.
The perfect software for ECG, EMG and EEG data acquisition and analysis, LabChart Lightning is a powerful tool for biosignal recording and both quantitative and qualitative data analysis.